1. A Personal Note
Over the past couple of years, I’ve been thinking about a simple question: what if the PMO stopped trying to control and started trying to illuminate?
Most organizations run their PMOs like control towers. They issue directives, track compliance, demand updates. The overhead compounds. Status fields multiply. Meetings proliferate to keep pace with stale dashboards. By the time the team sees the data, it’s three weeks old and they’ve already moved on. The system meant to coordinate the work ends up taxing it.
Project Lighthouse is an exploration of a different way to think about coordination at scale. It’s not a tool. It’s a set of principles about what a PMO could be if it was designed around illumination instead of enforcement. This document focuses on one specific tool exploring those ideas, but Lighthouse itself is larger. The philosophy, the language, the operating model—there’s a much fuller conversation to have there. This is the first piece of it.
The real problem we’re starting with is this: when you ask teams to express their priorities in a ranked list, you’re asking them to compress something complex into something linear. A list tells you order. But order is not priority. And what gets lost in that compression is almost everything that actually matters.
This document explores a different way to see.
2. Project Lighthouse
Large organizations rarely fail for lack of effort. They fail because the systems built to coordinate the effort consume the effort. What gets called project management has become, in most enterprises, a parallel layer of compliance work bolted on top of the actual work, generating reports that lag reality and meetings that exist to compensate for the lag. Roughly a third of the modern knowledge worker’s week is spent describing their work to a tool so the tool can describe it back to leadership. It is a remarkable thing to build, on purpose, in the name of efficiency.
Project Lighthouse is the work of asking a different question. What would coordination look like if the system shifted from active enforcement to passive instrumentation? What if a PMO existed to illuminate, not to manage?
Two kinds of output have come from the inquiry so far. The first is principles: the argument against PMO as a control tower, the case for PMO as a lighthouse, the case against assembly-line work language, the question of where ownership actually belongs in a team. Each is part of a longer conversation that does not fit in any single document. This document touches a few and points at the rest. The second kind of output is software: views and tools that make a piece of the philosophy real and testable. PrioritEyes, described in the next section, is the first of them. It is a view of work, not a product to be administered. Most of what follows is about PrioritEyes.
Control tower or lighthouse?
Names matter. The metaphor a system carries shapes what the people inside it can imagine doing. Most enterprise tooling sits on the metaphor of the production line: backlogs, blockers, pipelines, throughput. That metaphor brought a particular theory of work with it, and the theory has shaped a generation of tools. Project Lighthouse was named deliberately to bring a different theory of work into the room.
A lighthouse is a peculiar piece of infrastructure. It does not control the ships that pass it. It does not steer them. It issues no orders, files no reports, holds no quarterly reviews. It does two things only: it illuminates the path toward the destination so every vessel can align without being instructed, and it warns of hazards so no one steers into the rocks. Everything else, who sails when, in what order, at what speed, is left to the people on the water. The lighthouse is present, useful, calm, and mostly silent. It makes the rocks the center of attention when there are rocks.
Most enterprise PMOs work the other way around. They control, and the control costs the organization continuously. Status fields must be updated. Dependencies declared. Columns moved. Each of these is a small tax on a contributor who otherwise has actual work to do, and the value produced in return is mostly visibility for whoever sits above the contributor. The organization gets a great deal of visibility and not much awareness. The two are not the same thing.
The tax compounds beyond the contributor’s individual time. Layers of active oversight introduce communication bottlenecks: every signal climbs a chain of reviewers, every decision waits for the right meeting to be scheduled, every feedback loop stretches longer than it should. Complexity that would be manageable inside a team becomes a queue at the edge of every team. PMO as a Control Tower does not just slow the individual; it slows the system. Meetings get added to compensate for stale dashboards. Dashboards get refreshed to keep up with meetings. Neither catches up to reality. The cycle is the cost, not the bug.
Under all of this sits a deeper trap. When complexity grows, the reflex is to treat coordination as a math problem. More variables, more inputs, more reporting, more dependency mapping, more tracking. Put on the mathematician hat and the response to complexity is always to add. Add another field. Add another column. Add another status. Add another meeting to review what was added. The result is not clarity; it is complexity layered on top of complexity. Coordination is not a math problem. The work of a system serving people through complexity is to remove noise, not to model every variable. Simplification is the move that scales. Adding overhead in the name of visibility is the move that quietly consumes the operation it claims to serve.
The shift from active enforcement to quiet illumination is the entire move. PMO as a Lighthouse is, structurally, an instrument. It sits in the background. It surfaces only what matters, only when it matters. It speaks twice: when the direction needs to be made visible, and when there are rocks. The rest of the time it stays quiet, and the team gets on with the work.
The two responsibilities of PMO as a Lighthouse are clean enough to write on a coaster:
- Direction and alignment. Make what matters visible at every scale, so contributors self-organize toward it.
- Risk surfacing. Make hazards visible before they become incidents.
Anything a system in a scaled operation asks of its users beyond these two should directly add value to the work. If it doesn’t, it is waste. Most of what is asked today is waste.
Who this is for
The thinking behind Project Lighthouse came out of trying to align hundreds of contributors, individual people, whole teams, programs, on the priorities of a large operation. That experience is where the question got sharp. The cost of friction scales with the number of moving parts coordinating, and a system that stays out of the way is worth more in a thousand-person organization than in a five-person team. If you have ever sat in a steering committee staring at a slide that was already three weeks stale, the experiment is for you.
PrioritEyes is useful across that range. A team uses it to see the shape of its own portfolio without having to maintain it. A program leader uses it to see how a dozen teams’ priorities relate to each other. An individual uses it when textual lists fail them, when they carry more priorities than working memory can hold, when relative weight matters more than ordering. The view does not require an organization. One person with too many things in their head is a valid user.
If the work is highly structured, fully understood, and never changes priority, conventional tools cover it well. They are simple, cheap, and require no learning. The experiment isn’t aimed there. It is aimed at the harder shape: a moving portfolio of competing priorities, with shifting weights and accumulating risks and contributors who are figuring it out as they go.
3. Priorities and Visualization
The problem PrioritEyes was built to address
The problem of prioritization at scale is not that nobody knows what their priorities are. Most teams can list them. The question is whether the list is still the right medium when the work gets bigger.
A ranked list is one of the most powerful tools ever invented for organizing thought. Lists are cheap. They require no tool, no training, no setup, no software. Anyone can make one on the back of a napkin and share it in any channel that carries text. For a personal checklist on a Saturday, a list is exactly right. For five items whose relationships are clear, a list is exactly right. The argument here is not that lists are bad. The opposite. Lists are so good at what they do that we reach for them when the job has outgrown them.
This is the hammer-and-nail problem. The list is the favorite hammer. After a while, every problem starts looking like a list. The portfolio of fifty initiatives across six teams becomes a list. The shifting weights of competing priorities become a list. The accumulating risks become a list. And the list, faithfully, still says exactly what it always said: item 1 is above item 2 is above item 3. The information that would actually help, how much above, what is driving which, what is at risk, where the team’s load is concentrated, where things have shifted in the last two weeks, is nowhere on the screen.
This is the gap PrioritEyes is built to close.
What PrioritEyes is
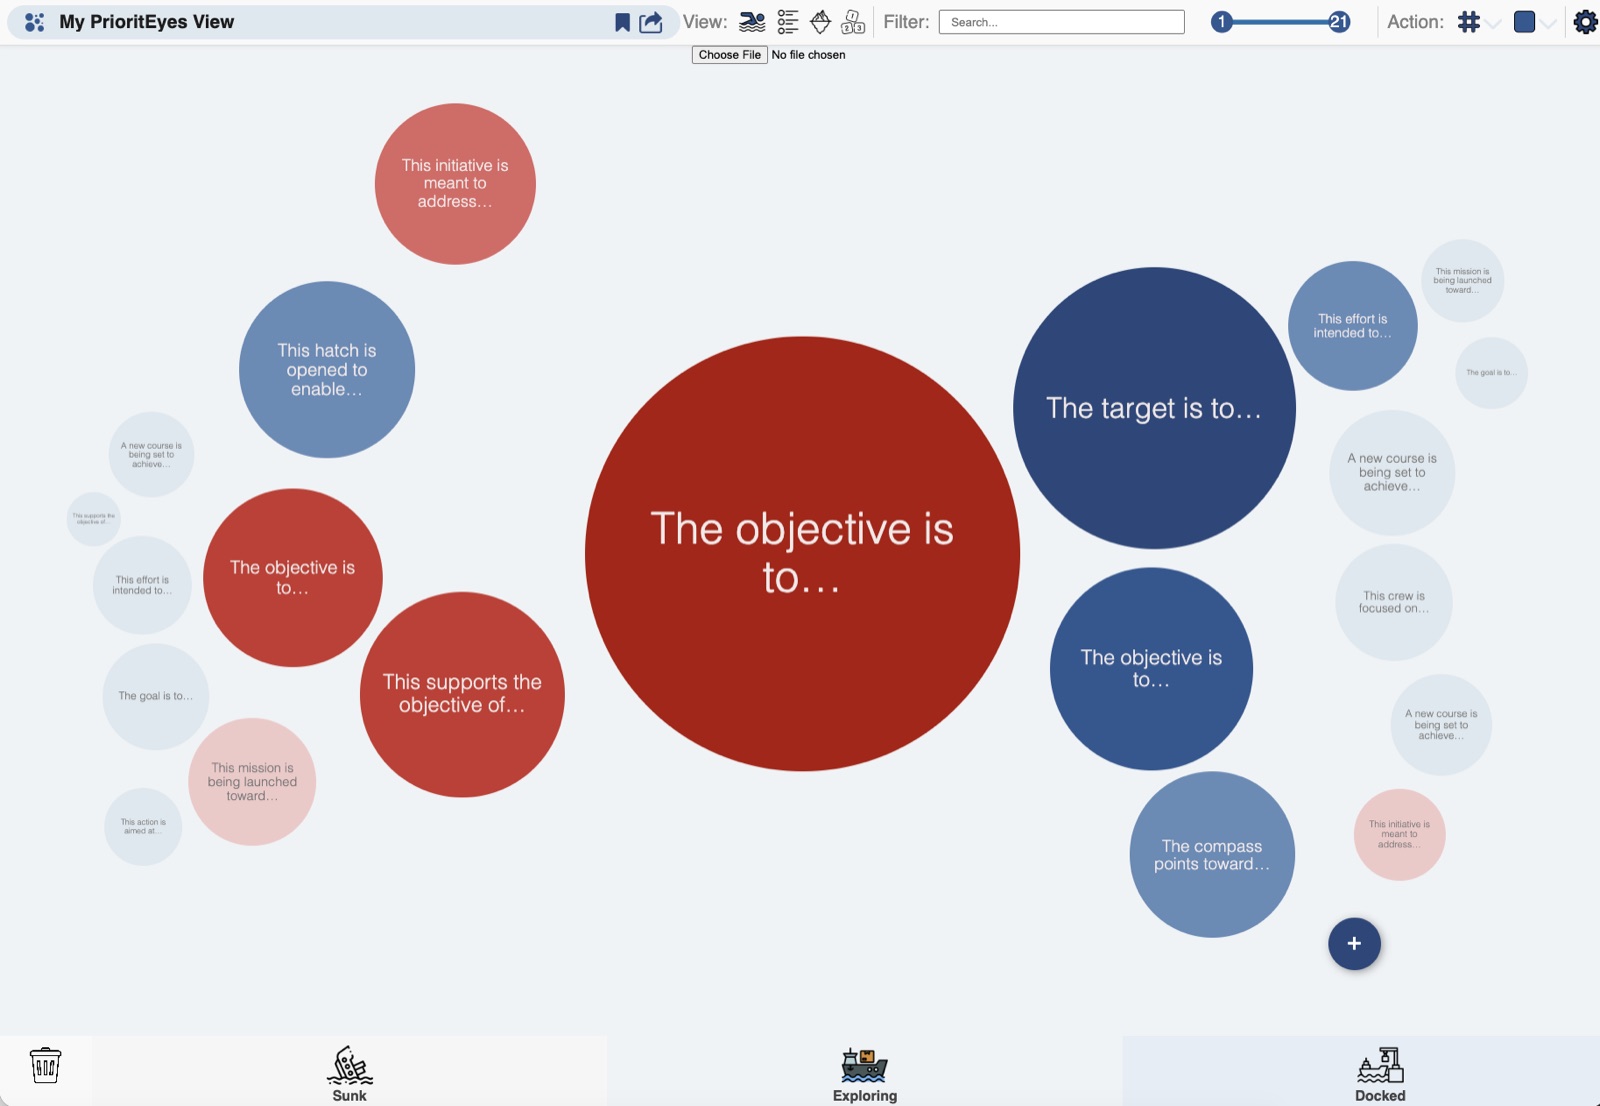
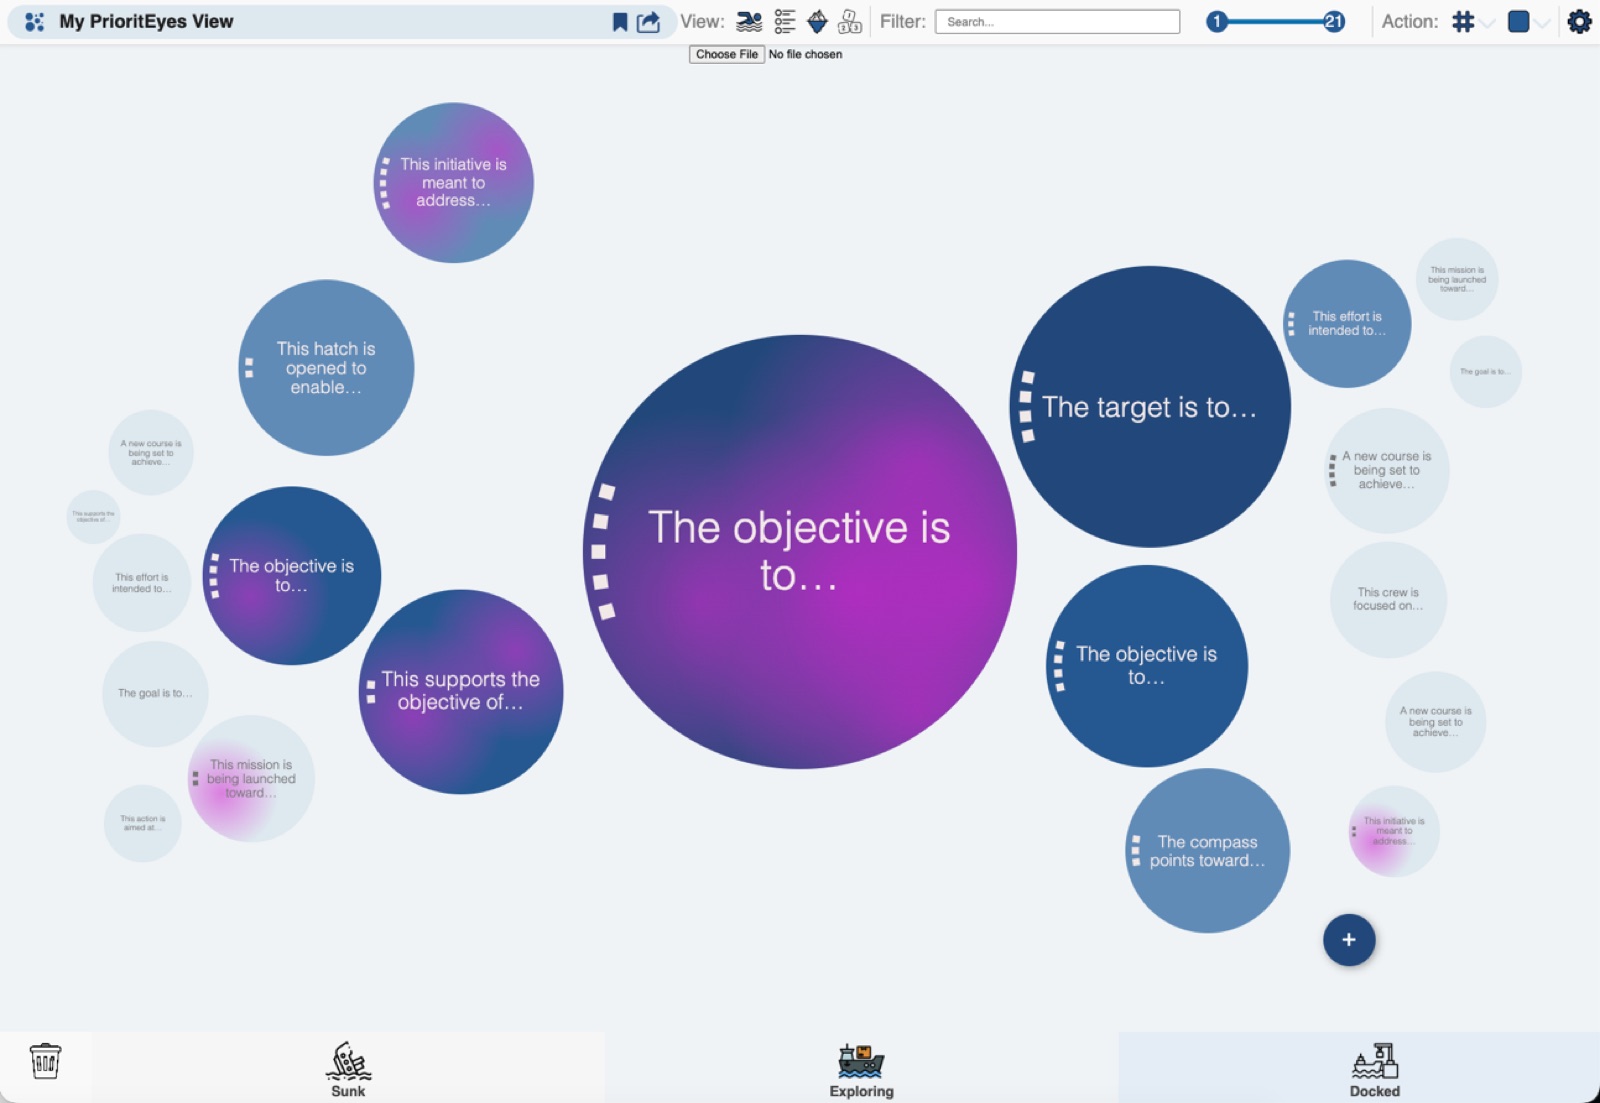
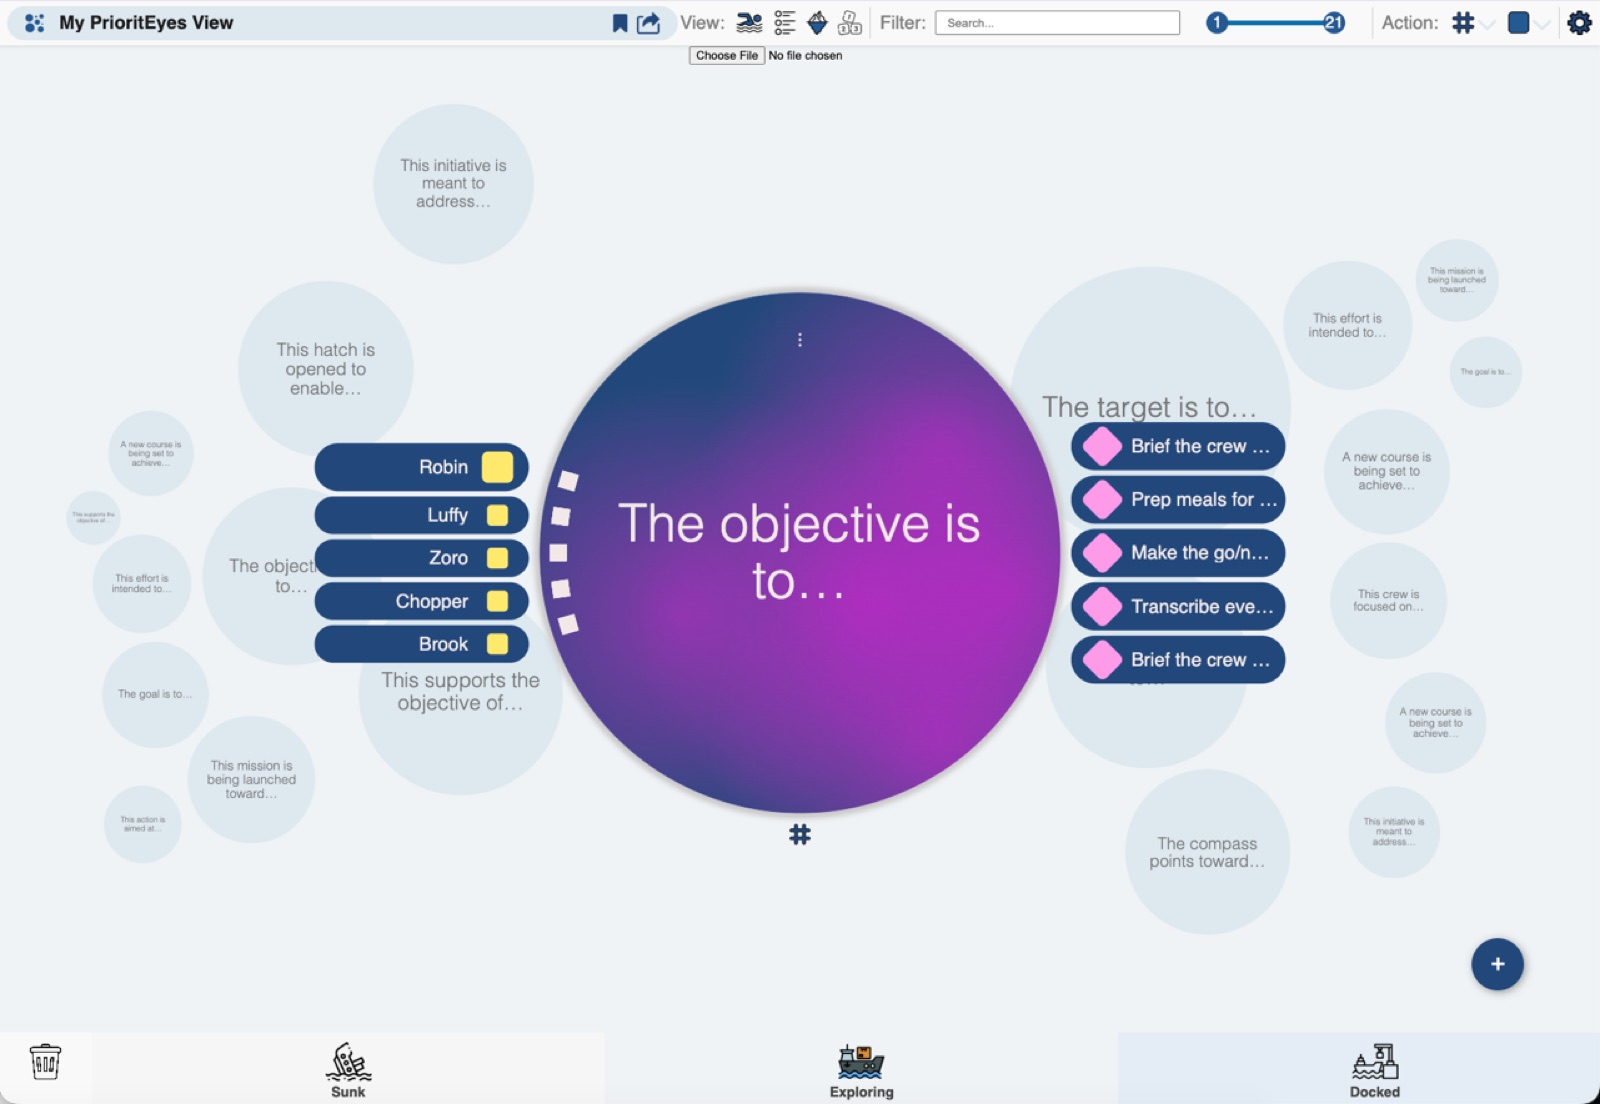
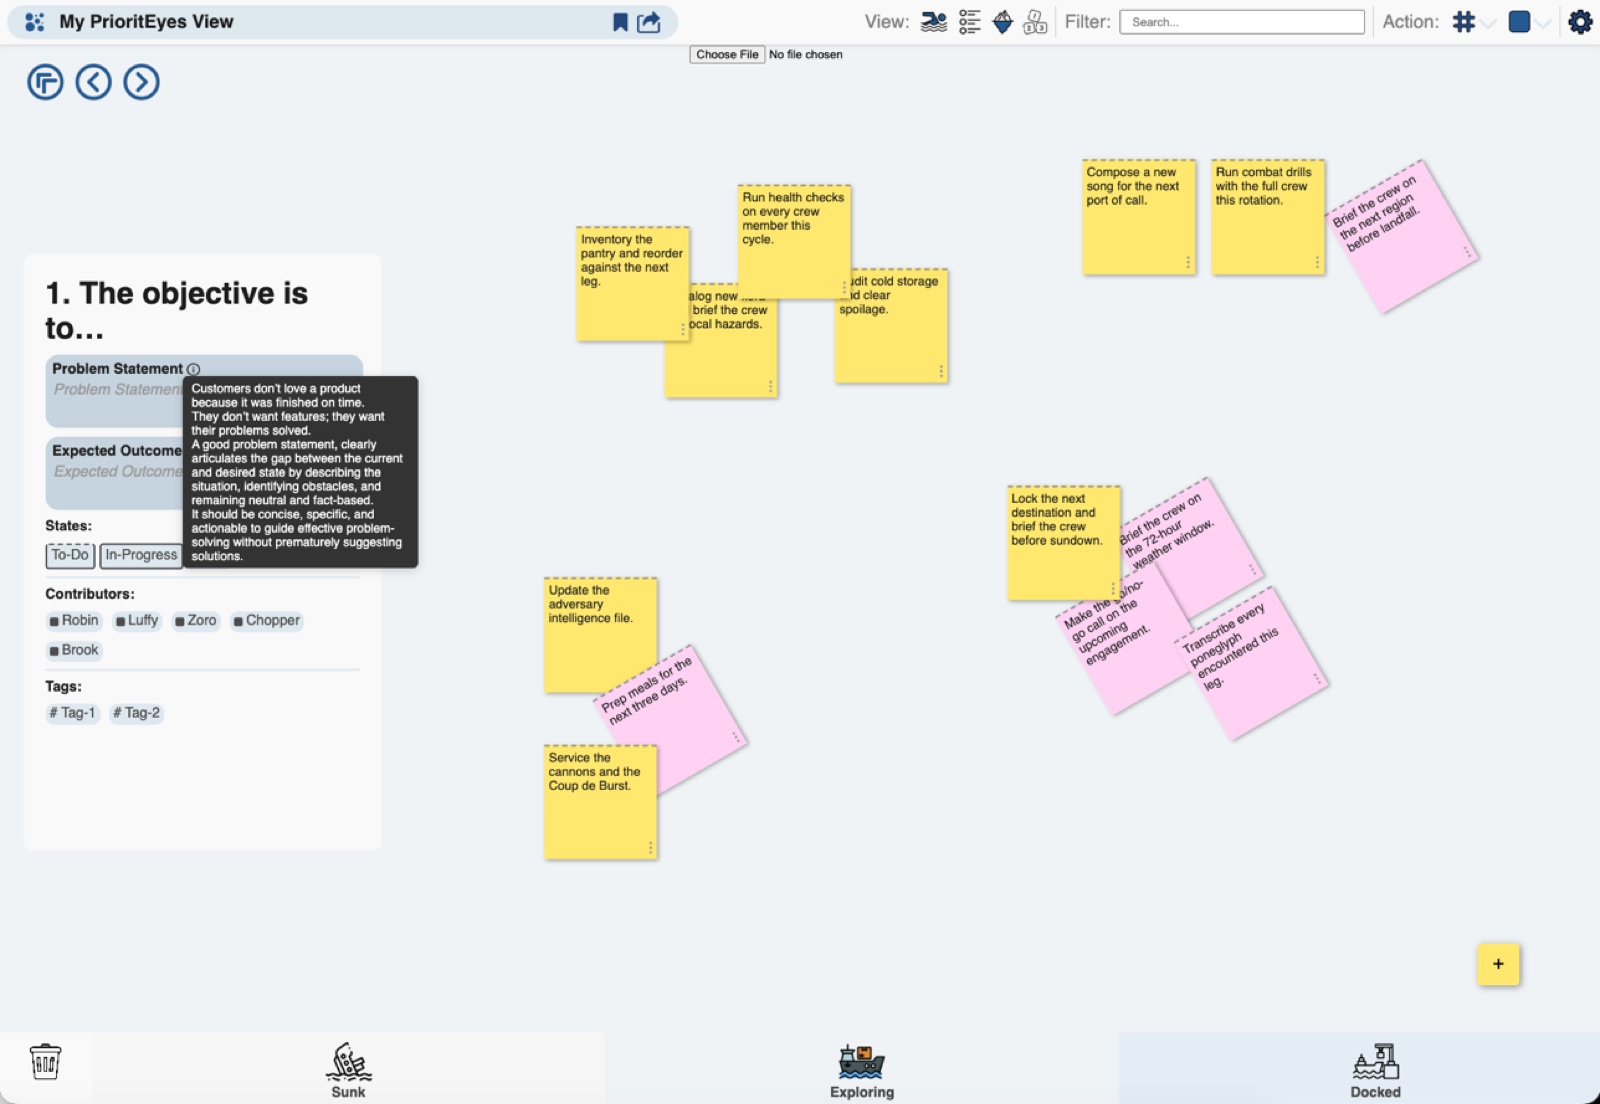
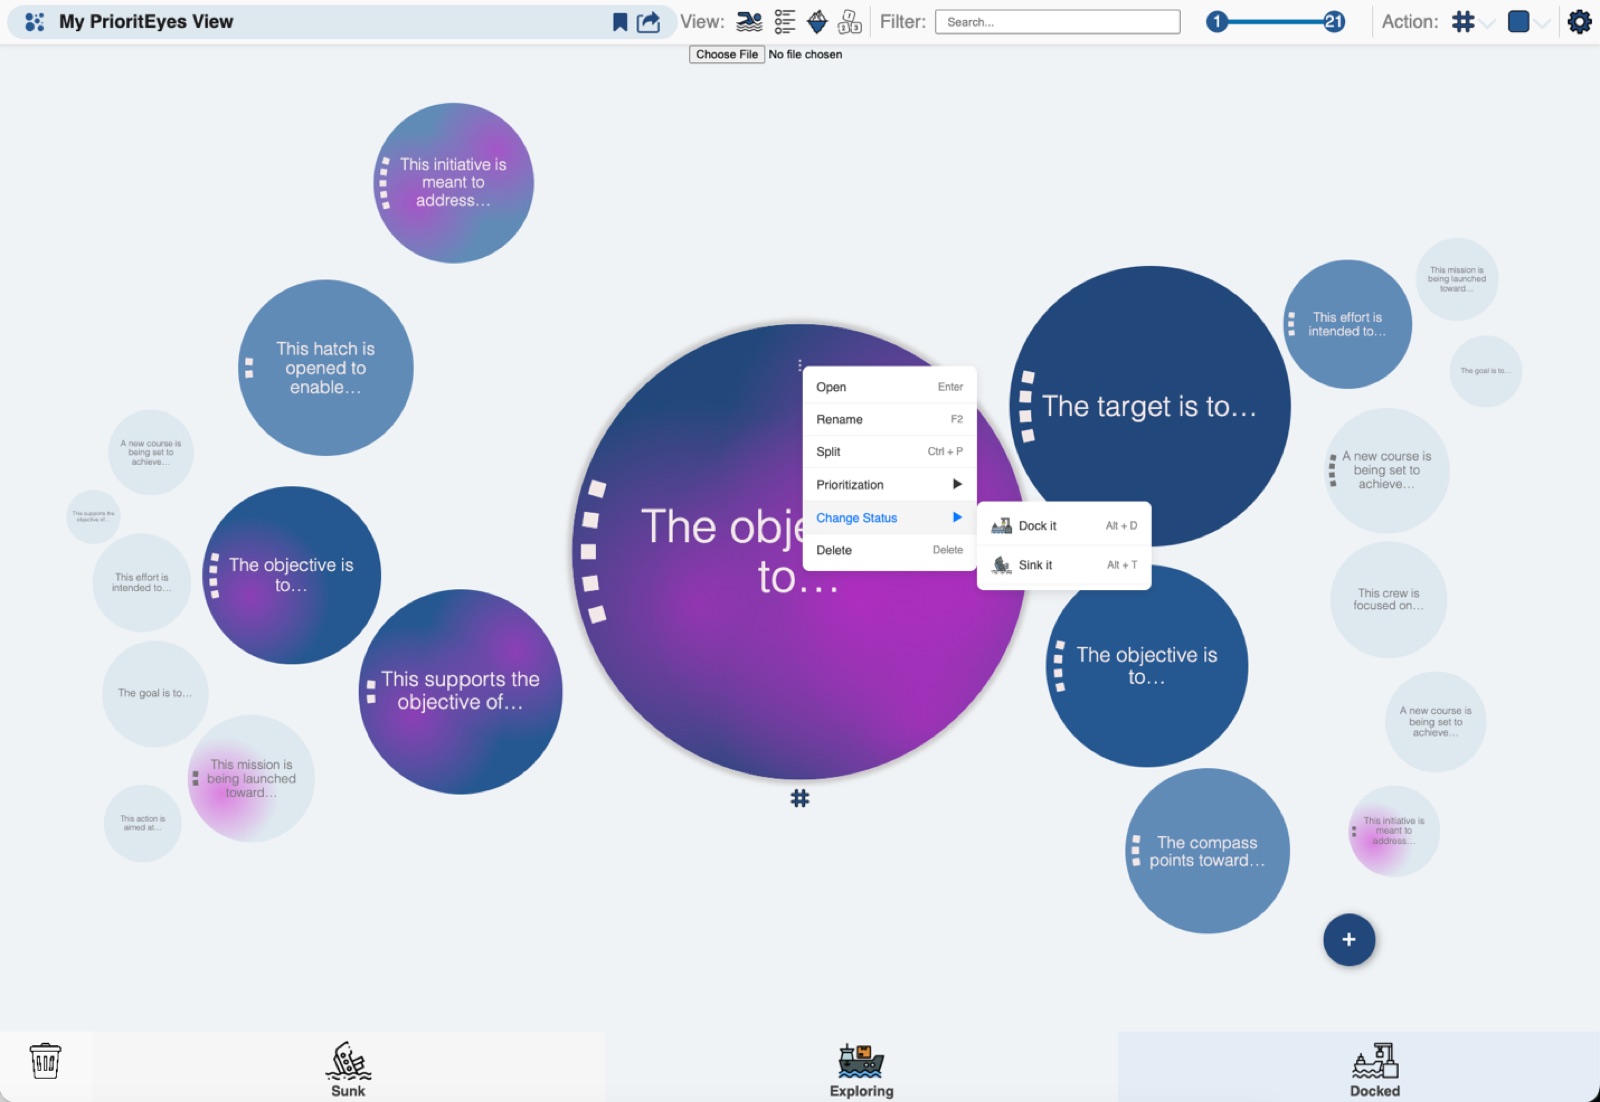
PrioritEyes is a view. The active surface is a canvas, not a list. Every initiative is a bubble. The bubble’s size is its priority. Its position in the layered, concentric layout reflects its relative weight against everything else on the board, with the largest at the center. Its tier fading softens lower-priority bubbles into the background, so the eye is drawn to what matters without being told to look. Small splashes accumulate on the bubble’s surface as risks are flagged against it, more flags producing a more visibly punctuated bubble. Contributor arcs ring the bubble’s edge, one arc per person or team carrying the work, fanning out so the team’s shape is readable at a glance. When a bubble is selected, contributor cards, tags, flag content, and the bubble’s problem statement and expected outcome open up beside it. The states a bubble can occupy are docked at the bottom of the screen: Exploring for active work, Docked for arrived, Sunk for didn’t make it, Trash for shouldn’t have been there. Dragging a bubble onto a state is how the bubble moves through its life.
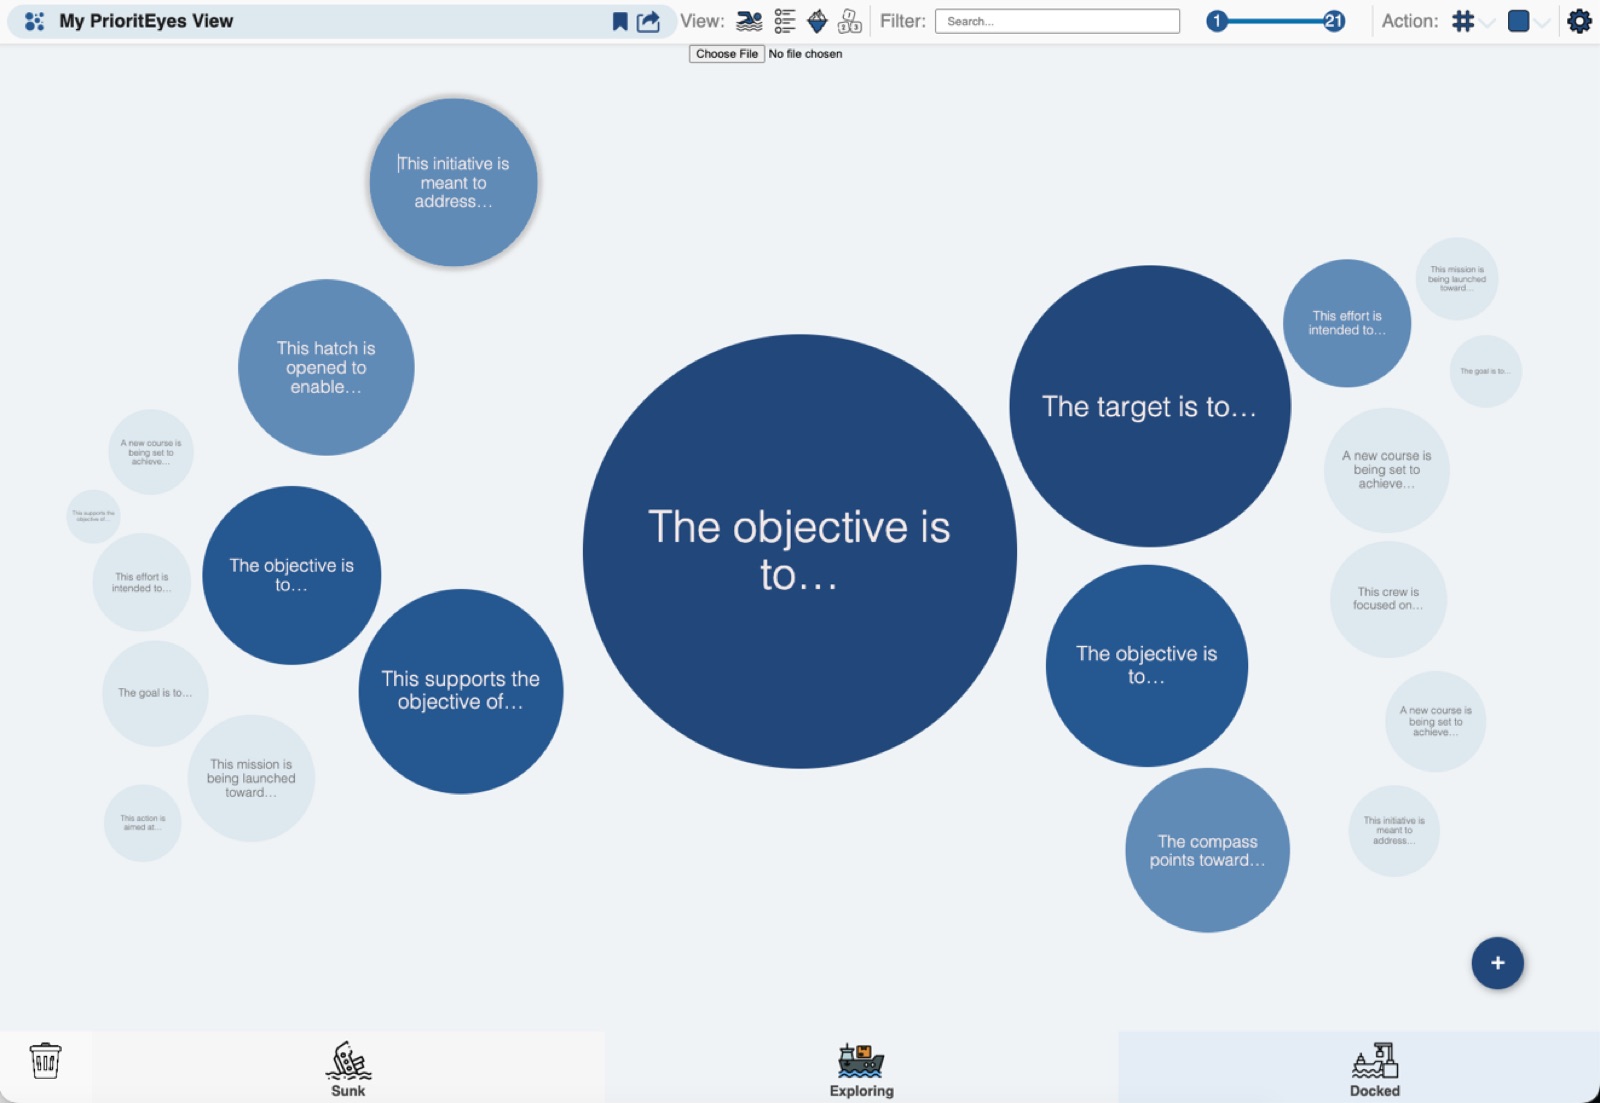
Beyond the canvas itself, PrioritEyes has three further surfaces:
-
Underlay and Overlay toggles control how much information is shown on each bubble at rest. Overlay reveals contributor arcs and risk splashes on every bubble simultaneously. Underlay pulls back to the quietest form, where only size and position carry meaning. The user picks the level of detail they want, when they want it.
-
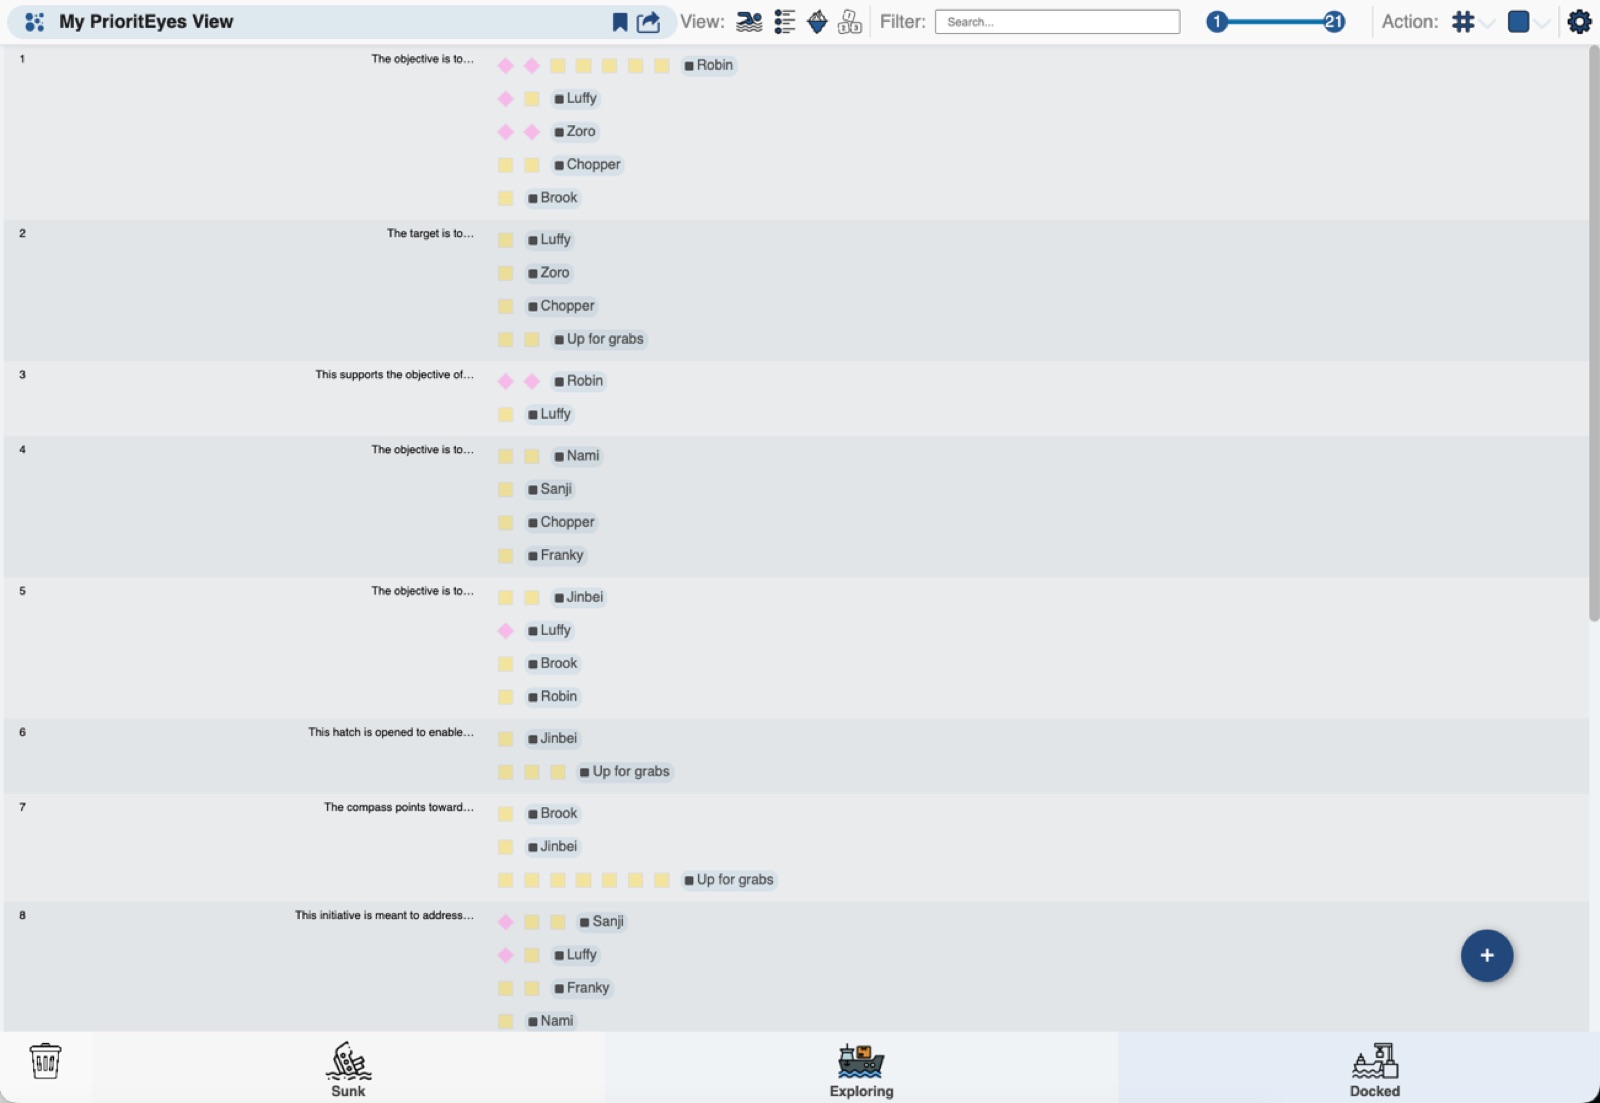
Overview and Streams, the alternate view, restructures the same priorities into rows where each bubble’s contributors and their sticky notes are laid out in swimlanes. Same data, different reading.
-
Details, the per-bubble surface, expands a single bubble into its problem statement, its expected outcome, its sticky notes, its contributors, its flags, and a free canvas for the team’s working notes.
Why visual representation works
The case for replacing ranked lists with visual canvases is not aesthetic. It rests on what the visual system actually does, and the science has been settled for half a century.
Here is the core fact. The eye is fast and parallel. The conscious mind is slow and serial. The eye processes certain visual properties, size, position, orientation, color, motion, in roughly two hundred milliseconds, across the entire field of view at once, without conscious attention. Reading text, by contrast, is sequential. The reader takes in one row, holds it in working memory, takes in the next, compares, and continues. Working memory has a ceiling somewhere around four to seven items. A list of fifty priorities is, by any honest accounting, ten times more than the reader can hold in mind at once. By the time the eye reaches the bottom of the list, the top is gone.
Prioritization is fundamentally a comparison problem, and a textual ranking throws magnitude away. The reader is expected to remember the relative sizes separately, in their head, where they will not be remembered accurately.
A visual canvas refuses to throw the magnitudes away. A bubble that is ten times the area of another bubble looks ten times the area. A bubble barely larger looks barely larger. The eye reads the proportion without anyone asking. Fifty bubbles fit into a single glance not because the viewer is unusually capable, but because the brain was built to process scenes this way.
This is the part most enterprise software has refused to take seriously for forty years. The same principle is operational in aviation, defense, air traffic control, and emergency response, the domains where the cost of slow comprehension is measured in lives. Their displays do not look like Jira. They look much more like the kind of canvas PrioritEyes is.
But pre-attentive perception, on its own, would only justify “use bubbles instead of rows.” The deeper move PrioritEyes makes is about removing noise while adding dimensions. The two sound contradictory and aren’t.
Noise is information that costs cognitive effort and doesn’t reward it. A status field a contributor must fill in, a column they must move a card between, a color-coded category whose key they have to remember: all noise. They consume attention and return little signal.
A dimension is different. A dimension is a visual channel that the eye reads in parallel, automatically, while it is already reading another channel. Stacking dimensions onto the same object lets the brain absorb more information in the same glance, not less. Size encodes priority. Tier fading reinforces it: less important bubbles soften into the background, so the eye doesn’t even have to compare; the canvas itself does the sorting. Splashes accumulate on a bubble as it acquires risk, so the bubble’s appearance shifts as the risk grows; risk is felt, not counted. Contributor arcs fan around the bubble’s edge, so team density is visible at a distance. None of these dimensions costs the user any cognitive load to read. The eye is already doing the work.
Color is one of these dimensions, used with restraint. The view does not load color with status semantics; it does not paint things red because they are bad or green because they are good. The user is never asked to memorize a traffic-light key. Color does two specific jobs. It fades lower-priority bubbles, reinforcing the size signal with a second channel. It accents the small accumulations of risk, contributor cues, and active state so they are visible without being noisy. The result is calm where most dashboards are loud, and read at a glance where most dashboards take a minute.
Detail itself is layered, not dumped. The board at rest shows the priority landscape and risk landscape together, no further effort required. A user who wants more selects a bubble, and contributors, tags, flags, and statement fields open up beside it. A user who wants more still opens its details view, with its full canvas of sticky notes. The interface discloses depth in stages, on the user’s terms, never zero to a hundred in one click. Progressive disclosure is how a complex portfolio remains readable without being simplified.
This is the design principle underneath all of it: optimized clarity through multi-dimensional encoding and progressive disclosure. Let the brain do the work that the conscious mind has been forced to do, badly, in every PM tool of the last forty years.
Bubbles vs lists, in practice
The previous section explained why. This is what it looks like in a room.
Picture a portfolio of fifty initiatives. The two highest priorities sit at the top of a ranked backlog, labeled 1 and 2. They look identical on screen. Same row height, same font, same visual weight. The list will not tell you whether they are roughly tied for importance, or whether item 1 is twice as valuable as item 2.
Now item 1 hits a blocker. A vendor delays. A dependency slips. The team has to decide whether to push through the blocker or pivot to item 2 while the blocker gets unstuck.
If the team is looking at a list, this decision is made on incomplete information. They know item 1 is “above” item 2 and not much else. The conversation defaults to “push through, it was number one,” and the team sinks another two weeks into clearing the obstacle. They may have made the right call. They may have wasted the time. The list won’t help them know.
If the same team is looking at a PrioritEyes canvas, the two bubbles’ proportions are honest. If they are nearly the same size, the team sees it at a glance, and the answer is obvious: pivot to item 2 and capture comparable value while item 1 unblocks. If item 2 is half the size of item 1, the team sees that too, and reaches the opposite decision: push through, because nothing else in the portfolio is close in value. The list could not transmit either story. The canvas transmits both in the time it takes the list to render.
Clutter
A list of fifty initiatives, twenty columns of metadata, comments threaded below, dependencies indented into sub-rows: everything technically on screen, every row the same visual weight, the trivial item asking for the same attention as the critical one. The user’s eye, with nowhere to rest, drifts. By the time they reach the middle, the top is out of working memory.
There is a famous experiment in which viewers, focused on counting basketball passes, failed half the time to notice a person in a gorilla suit walking straight through the scene. When the visual field is loaded with similar-weight items competing for attention, the brain copes by selecting a few and ignoring the rest. Row 35 of a backlog suffers the same fate: technically visible, effectively unseen. It is not a deficit in the user. It is how attention works.
The PrioritEyes canvas works with attention rather than against it. Larger bubbles hold the center. Smaller bubbles fade. The eye rests where the priorities are; the periphery softens and recedes. The viewer reads what matters without the cost of explicit filtering. The list view fights the visual system. The canvas lets it work.
4. Language
Why language matters
The vocabulary inside a tool is not decoration. It is the lens through which the team sees their own work. Two systems can record the same row in the same database and produce two different organizations, depending on what they call that row.
This is not a soft observation. It is a central finding in cognitive linguistics: abstract reasoning is built out of concrete, often physical, metaphors. Argument is war. Time is money. Understanding is seeing. These are not figures of speech laid on top of clean abstract thought. They are the thought. The metaphor shapes what the thinker can conceive, what counts as a sensible move, and what feels wrong. Change the metaphor and you change the cognition.
Most project management vocabulary has inherited a single metaphor: WORK IS PRODUCTION. Items accumulate in a backlog, the way unfinished cars accumulate at a station. Obstacles block the line. Output is delivered. Completion is terminal. This metaphor is fine for assembling cars. It is dishonest for knowledge work, which behaves much more like navigation under fog. The team is not progressing along a known path. The team is figuring out how to get there, while they move, while they correct course, while they learn whether the original framing of the problem was even right.
PrioritEyes replaces the production metaphor with WORK IS NAVIGATION. The bubble is a vessel. It explores. It can be docked, sunk, or thrown out. It carries a crew. It can drift. Three example terms follow. There are others inside the product, and finding the rest is more interesting than being told.
Exploring (instead of “In Progress”)
“In Progress” assumes the team knows the route and is simply walking it. It assumes the requirements handed down are the right way to solve the problem, and execution is what’s left. Most modern work does not look like that. The team often knows where it is headed; what is unknown is the how, the approach, the actual route through the fog. “Exploring” tells the truth. It is a small but persistent reminder, every time the word appears in the interface, that the team is still finding the way. The requirements are a starting hypothesis about how to solve the problem, not the final answer. Course correction is the default condition, not the exception. The team’s first job is not to deliver against the plan. It is to keep asking whether the route makes sense.
Docked (instead of “Done”)
“Done” pretends a fact that isn’t true. Software is not done when it ships. An initiative is not done when its launch is announced. The product is in the world; users are using it; users are being affected by it; the team that built it is being affected too, through the maintenance load, the support tickets, the way it shapes what they can build next, the gap between what was assumed about it and what is actually true. As long as the work is out there and influencing reality, the work is still happening, just on a different axis. “Done” closes a door that is not closed.
“Docked” tells the truth. A bubble that is Docked has arrived. The active push is over. But the bubble does not vanish from the board. It stays visible, watched, available for the team to observe whether their assumptions held up under contact with users. The bubble can be un-docked if reality demands it. The state acknowledges that arrival is not the same as resolution; the work continues to matter as long as it is in use.
Up for Grabs (instead of “Unassigned”)
“Unassigned” implies a piece of work waiting for an authority to hand it to someone. Work pushed down the org chart, contributors as executors, outcomes owned by whoever assigned the task in the first place.
“Up for Grabs” inverts the assumption. The unit of productivity is the team, not the individual. A team member looking at the board doesn’t receive work; they reach for it. They take ownership of the outcome, including the responsibility to push back if the framing was wrong. The work isn’t waiting for permission. It is available to whoever decides to carry it. This sounds like a label change. It is, in practice, a different theory of how an organization should run.
Find the rest, build your own
The interface has more deliberate words in it. A more honest name for the state where an idea didn’t make it. A default status for a new bubble that treats the contributor as ready to engage, not as someone owing the list. Nineteen rotating opening phrases, designed to nudge the writer toward articulating an outcome rather than listing activity.
Worth finding. More worth asking: what words is your team stuck with that you wouldn’t choose if you got to start over?
5. What’s next
PrioritEyes is the first instrument. It is not the last. Several further directions are being explored, some software, some principles.
On the software side:
-
Dependency visualization that makes structural fragility visible without imposing the maintenance overhead that conventional dependency tracking demands. The current canvas shows what matters and what is at risk; it does not yet show what is blocking what. The interesting question is whether dependencies can be surfaced in the same quiet, pre-attentive style, without turning the canvas into a network diagram.
-
Integration with the systems organizations already run on, including Jira, Asana, Smartsheets, and the inevitable Excel sheets. PMO as a Lighthouse does not replace these tools. It reads from them. The aim is to ingest whatever ground truth the organization is already producing and project it through a Lighthouse view, so no one has to maintain a second system.
-
A time machine. A way to see how the priority landscape has shifted across weeks, months, and quarters. Watch a bubble grow over time as the world decided it was more important. See which bubbles were sunk early and which fought their way back. The portfolio’s history, told visually, instead of buried in commit logs and quarterly slides.
On the principles side, the interest is in continuing to articulate ways of thinking about coordination, ownership, and decision-making at scale that any organization can adopt independent of any tool. The lexicon work is the first of these. There will be more.
The hypothesis is narrow on purpose. Clearer communication of priorities and risk, with less noise and lower overhead, produces better alignment in scaled operations. That is the claim. Nothing larger. PrioritEyes is the first test. The lexicon work is a parallel test of the same hypothesis from the language side. The questions still open:
-
Does visual prioritization, at scale, produce better alignment than ranked lists?
-
Does removing administrative overhead change how often teams re-prioritize, and does more frequent re-prioritization produce better outcomes?
-
Does the vocabulary shift, away from mechanical work language toward navigational and outcome-aware language, change how teams reason about their work?
-
What is the minimum set of instruments tomorrow’s PMOs will actually need?
-
Can a system designed around perceptual psychology survive contact with the people who do the work?
These are the open questions of the project. The experiment is being run in public so the people whose work it is meant to serve can shape what it becomes.
Try it, and tell us
The view is live at https://project-lighthouse.pages.dev.
Try it. Where the canvas tells you something a ranked list never could, that’s the experiment working. Where the seams show, and they will, that’s the feedback worth having. This is young. Expect bugs, gaps, the occasional huh, that’s-weird moment. What vocabulary would your team replace if you got to start over? Tell me about all of it. It shapes what comes next.
6. Further reading
For readers who want to follow the underlying science.
Show the reading list
On pre-attentive visual processing
- Treisman, A. M., & Gelade, G. (1980). A feature-integration theory of attention. Cognitive Psychology, 12(1), 97-136. The foundational paper showing that certain visual features (size, color, position) are processed in parallel without conscious attention.
- Healey, C. G., & Enns, J. T. (2012). Attention and visual memory in visualization and computer graphics. IEEE Transactions on Visualization and Computer Graphics, 18(7), 1170-1188. The canonical survey of pre-attentive features for visualization designers.
On working memory and cognitive load
- Miller, G. A. (1956). The magical number seven, plus or minus two. Psychological Review, 63(2), 81-97. The original short-term memory capacity finding.
- Cowan, N. (2001). The magical number 4 in short-term memory: A reconsideration of mental storage capacity. Behavioral and Brain Sciences, 24(1), 87-114. The modern revision of Miller’s figure.
- Sweller, J. (1988). Cognitive load during problem solving. Cognitive Science, 12(2), 257-285. The theory of intrinsic vs extraneous load on working memory.
On attention and inattentional blindness
- Simons, D. J., & Chabris, C. F. (1999). Gorillas in our midst: Sustained inattentional blindness for dynamic events. Perception, 28(9), 1059-1074. The “Invisible Gorilla” experiment demonstrating how focused attention causes failure to notice unexpected stimuli in plain sight.
On visual reasoning
- Larkin, J. H., & Simon, H. A. (1987). Why a diagram is (sometimes) worth ten thousand words. Cognitive Science, 11(1), 65-100. The argument that diagrams are not prettier text, but a different kind of computational object.
- Paivio, A. Dual-coding theory. The framework behind the picture superiority effect.
On situation awareness
- Endsley, M. R. (1995). Toward a theory of situation awareness in dynamic systems. Human Factors, 37(1), 32-64. The three-level model used operationally in aviation, defense, and emergency response.
On interface design
- Shneiderman, B. (1983). Direct manipulation: A step beyond programming languages. Computer, 16(8), 57-69. The foundational argument that interfaces in which users act on visible objects directly produce stronger mental models and faster learning.
On language and conceptual structure
- Lakoff, G., & Johnson, M. (1980). Metaphors We Live By. University of Chicago Press. The book establishing that abstract reasoning is structured by concrete conceptual metaphors.